It’s been said that 80% of data has a spatial component. This course will look beyond simply mapping spatial data and provide an introduction to spatial analysis techniques. Since this course is aimed at data analysts, we will focus on human rather than physical geography and thus vector rather than raster datasets. The software used is open source and the datasets used are open data. It is in this spirit that these training materials are released under a creative commons license.
Materials
Session 1: presentation - Introduction to GIS
In the first session we will introduce GIS - what it is and why use it? Some of the key concepts for GIS such as scale and projections will be introduced.
Session 2: practical - Introduction to GIS with QGIS
The aim of this practical session is to provide a hands-on introduction to doing GIS with QGIS. We will focus on vector data, in particular point and polygon analysis. The exercises have been tested using version 3.8 of QGIS.
Data for exercises (zip file 41Mb)
Session 3: presentation - Spatial analysis without a GIS
This session concentrates on tools such as R and Python that can be used for doing spatial analysis without using a GIS.
Data sources
Open data portals
UK Government open data portal
Specialist data sources
Indices of Deprivation 2019 England
Mapping
Reading and Resources
Context
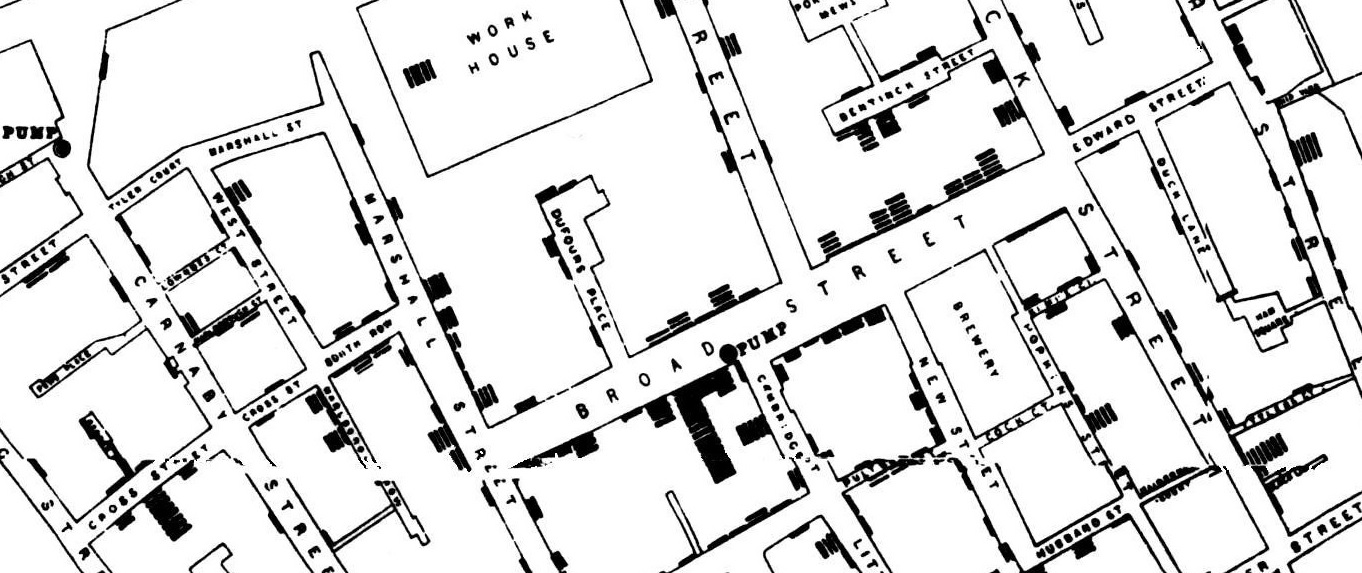
John Snow's data journalism: the cholera map that changed the world
Software
QGIS (this course is based on version 3.8)
GeoDa - spatial analysis tools
Python
Python - scripting or programming?
matplotlib - 2D plotting library
pandas - data structure library
geopandas - pandas with spatial elements
shapely - library for spatial object manipulation
Essential geospatial Python libraries (quick overview)
Long list of geospatial Python libraries
Python and QGIS
PyQGIS 101: Introduction to QGIS Python programming
R
Python vs R: Head to Head Data Analysis
Geocomputation with R (online book)
Data models
Vector vs Raster: What’s the Difference Between GIS Spatial Data Types?
Map projections
Choosing the Right Map Projection
YouTube clip from the West Wing on Map projections
A Guide to Coordinate Systems in Great Britain
Cartographic outputs

This work is licensed under a Creative Commons Attribution-NonCommercial-ShareAlike 4.0 International License.